
Popular figure-ground segmentation algorithms generate a pool of boundary-aligned segment proposals that can be used in subsequent object recognition engines. These algorithms can recover most image objects with high accuracy, but are usually computationally intensive since many graph cuts are computed with different enumerations of segment seeds. In this paper we propose an algorithm, RIGOR, for efficiently generating a pool of overlapping segment proposals in images. By precomputing a graph which can be used for parametric min-cuts over different seeds, we speed up the generation of the segment pool. In addition, we have made design choices that avoid extensive computations without losing performance. In particular, we demonstrate that the segmentation performance of our algorithm is slightly better than the state-of-the-art on the PASCAL VOC dataset, while being an order of magnitude faster.
Ahmad Humayun, Fuxin Li, and James M. Rehg.
RIGOR: Recycling Inference in Graph Cuts for generating Object Regions.
IEEE Conference on Computer Vision and Pattern Recognition (CVPR), June 2014.
PDF | Presentation | Poster | BibTeX
Download | Instructions
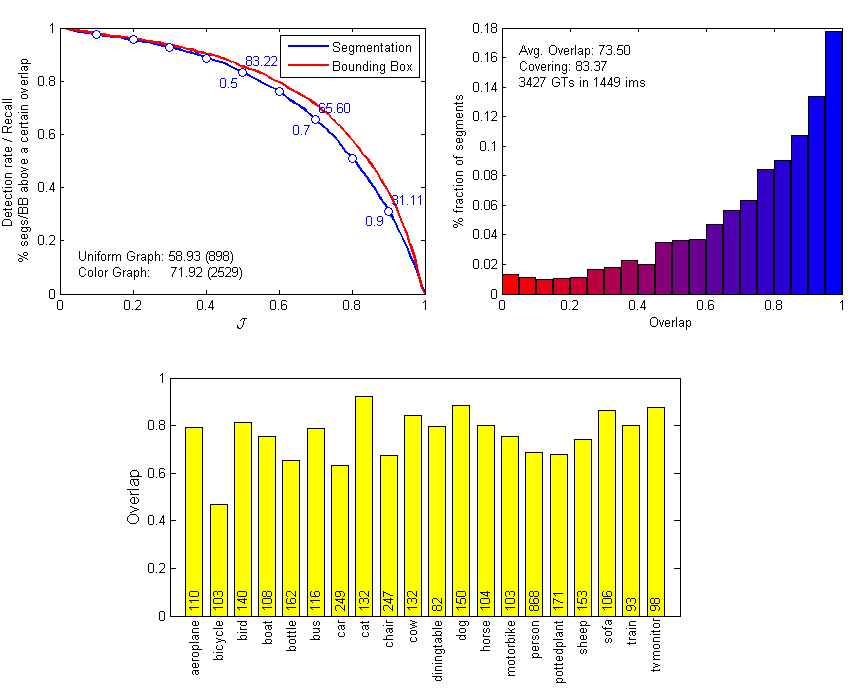
Quantitative results of RIGOR using 64 seeds (StructEdges-64) on the validation set of PASCAL VOC 2012 are stored in this mat file, and summarized in the figure below. This mat file has two structure variables, which are described in this readme. In the mat file, all results for individual images are ordered according to standard VOC 2012 segmentation validation file. The figure below was generated using MATLAB: voc_rigor_64seeds.fig. Note that the scores are slightly different than the paper, since the Structured Edges (Dollár and Zitnick, ICCV 2013) code has undergone some changes.
RIGOR performs parametric min-cut over different graph types, each of which specifies unaries differently. The two major graph types are uniform and color graphs (see paper/code). Uniform graphs define unaries based on the size of the superpixel. Color graphs define unaries based on the color difference to the seed superpixels.
The sub-figure on the top left gives detection rates/recall against increasing overlap score (intersection over union / Jaccard cofficient against the ground-truth segment). For each overlap value J (x-axis), we find the fraction of segments which have an overlap of ≥ J (y-axis). The blue curve shows the result for segmentation, and the red curve shows bounding box results. For the red curve, each ground-truth bounding box was generated by computing the smallest up-right rectangle that encloses the ground-truth segmentation. Similarly, bounding boxes were generated from RIGOR's segment proposals. The figure also shows the segmentation recall rates at J = 0.5, 0.7, and 0.9. At the bottom-left of the figure you will find the mean segmentation overlap score for each graph sub-type separately. It also tells how many times a proposal generated by a particular graph-type has the best overlapping segment to a ground-truth (totalling 3427 ground-truth segments).
The sub-figure on the top right gives the distribution of segmentation overlap scores. Results over all the 3427 ground-truths are divided into twenty bins of varying overlaps (x-axis). Given a bin's range, we compute the percentage of segments that falls in that bin (y-axis). Mean segmentation overlap score and covering score is given as text on the figure. Note that there are two ways to aggregate covering score over the whole dataset: (1) compute covering individually for each image, and then average over all images; or (2) compute covering score by considering all ground-truths as a single collection. The covering score on the figure is computed using technique (1). The paper gives covering score using technique (1). To the best of our knowledge, Geodesic Object Proposals (Krähenbühl and Koltun, ECCV 2014) gives covering score by technique (2) (see src/eval_baseline.py in their code). For PASCAL VOC 2012 validation set, RIGOR's covering score by technique (2) is 85.85.
The histogram at the bottom gives mean segmentation overlap scores for each ground-truth category. The number on each bar specifies the number of ground-truth segments for that category in the dataset.
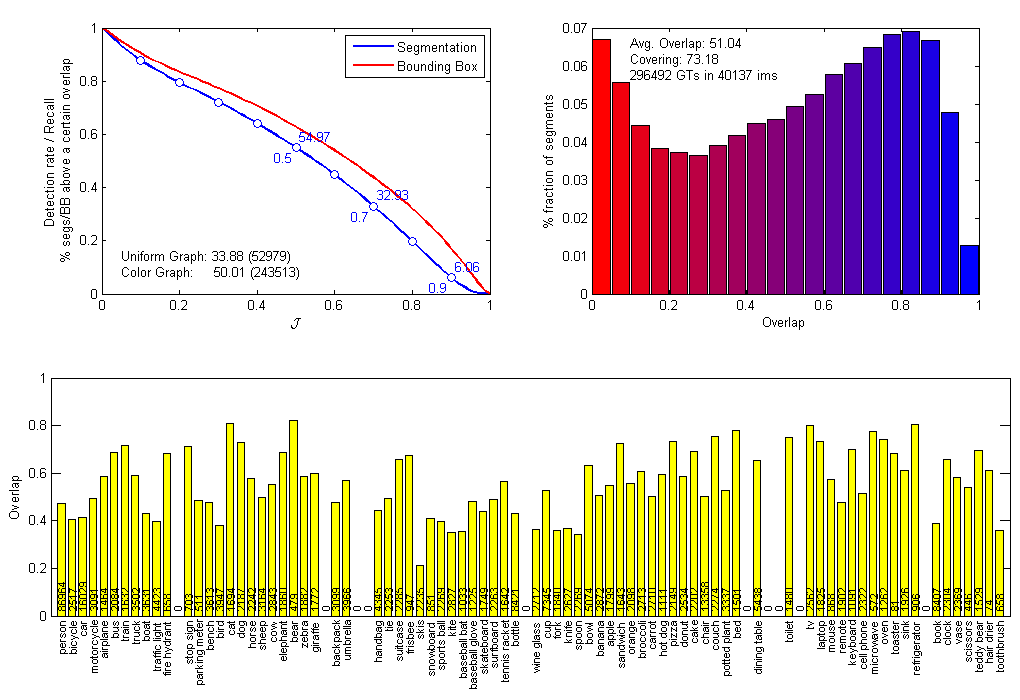
Quantitative results of RIGOR using 64 seeds (StructEdges-64) on the validation set of Microsoft COCO 2014 are stored in this mat file, and summarized in the figure below. Like before, this mat file has two structure variables, which are described in this readme. In the mat file, all results for individual images are ordered according to the image list given in this file. The figure below was generated using MATLAB: coco_rigor_64seeds.fig.
There were 40,137 images (containing at least one ground-truth) in the COCO validation set. In total there were 296,492 ground-truth segments.
See above for a description of the figures.
For COCO 2014 validation set, RIGOR's covering score by technique (2) is 78.52 (technique (2) is described above).
This work was supported in part by NSF grants IIS 1016772 and IIS 1320348.
The documents contained in these directories are included by the contributing authors as a means to ensure timely dissemination of scholarly and technical work on a non-commercial basis. Copyright and all rights therein are maintained by the authors or by other copyright holders, notwithstanding that they have offered their works here electronically. It is understood that all persons copying this information will adhere to the terms and constraints invoked by each author's copyright. These works may not be reposted without explicit permission of the copyright holder.
 |
 |